
An executive Google Ads dashboard is a senior-delivered, CFO-grade briefing that isolates marketing’s incremental contribution to revenue and recommends one to three concrete investment actions. It is not a feed of clicks and impressions. A dashboard that earns a seat at the finance table shows a headline marginal-impact metric, a short prioritized action list, and the measurement assumptions behind every number.
TL;DR:
- A CFO-grade Google Ads dashboard should prioritize marginal ROAS, incremental revenue, and contribution to margin, with clear confidence levels.
- Only a small set of key metrics and visuals should appear on the executive page, while detailed technical data belongs in the appendix.
- Decision-making depends on the confidence in lift results, with a focus on approved thresholds, trend analysis, and careful testing cadence.
- Measurement frameworks and attribution models must be agreed upon upfront, with transparency on test results, sample sizes, and model shifts.
- Regular updates and audits by senior staff enhance accuracy, prevent waste, and ensure the dashboard drives real budget decisions aligned with financial outcomes.
Table of Contents
- Core components and KPIs an executive dashboard must include
- How executives should read the dashboard and convert it into decisions
- Measurement and attribution: rules to agree on before reporting begins
- Implementation checklist: what to demand when commissioning a dashboard
- A senior operator’s note on what actually works
- How we build the executive dashboard at North Country Consulting
- FAQ
- Sources
Core components and KPIs an executive dashboard must include
Executives do not need forty rows of metrics. They need the few numbers that tell them whether ad spend is creating value, and whether to put more money behind it or pull back.
The headline KPIs belong at the top, not buried in an appendix:
- Marginal ROAS or cost per incremental acquisition, the return on the next dollar spent, not the average return across all spend.
- Incremental revenue or lift, measured against a holdout or geographic test rather than assumed from platform-reported conversions.
- Contribution to margin or EBITDA, translating ad performance into the language finance already uses.
Below the headline numbers, a small set of supporting visuals does the rest of the work: a trend-versus-plan chart, incremental lift broken out by test, channel mix contribution shown with confidence intervals rather than false precision, and a short appendix listing the campaign-level drivers behind any swing worth explaining.
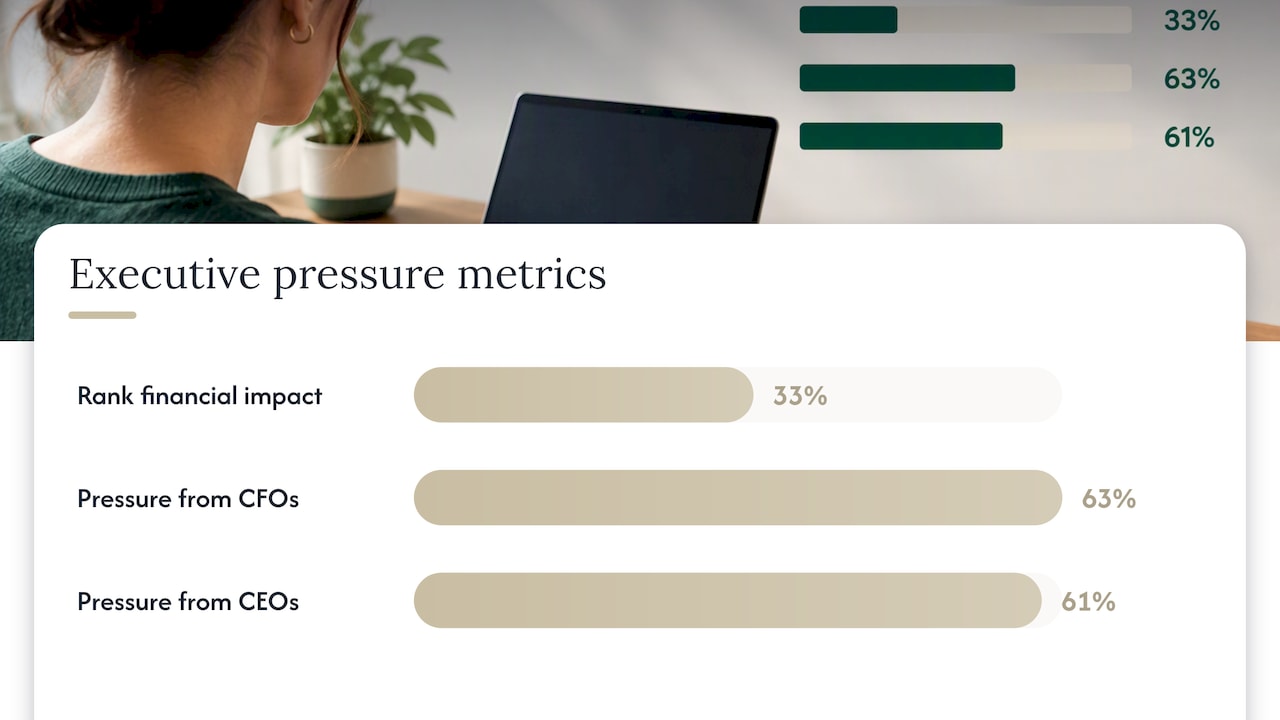
One in three marketing leaders now rank proving the financial impact of marketing as their single biggest challenge, with 63% reporting increased pressure from CFOs and 61% from CEOs to justify spend. That pressure is exactly why a dashboard built for the C-suite has to separate what is measured from what is modeled, and say so plainly. A figure drawn from a geo-holdout test carries a different confidence level than one projected from a media mix model, and an executive dashboard should label which is which, including sample size where a test is small enough that the result could be noise.
What gets left out matters as much as what gets included. Keep them in an operational appendix, never on the executive page.
How executives should read the dashboard and convert it into decisions
A dashboard only earns its keep when it changes a decision. The reading order matters: start with the marginal-impact headline, check it against the incrementality and sample-size notes beneath it, and only then decide whether the result is solid enough to act on.
- Read the headline number first. Is marginal ROAS trending up, flat, or down against the prior period and against plan?
- Check the confidence behind it. A lift result from a small test window with wide confidence bands is a signal to wait, not to reallocate budget.
- Apply a decision trigger. Accept a result that clears your pre-agreed confidence threshold and scale spend; investigate a result that falls in a gray zone before moving budget; hold if the incrementality data contradicts the platform-reported numbers.
- Document the action and the reasoning, so the next review starts from where this one ended.
A concrete trigger might read: if incremental lift from a geo test is significantly positive with acceptable confidence, approve a modest budget increase in that segment; if lift is moderate, hold spend flat and extend the test; if lift is minimal or statistically inconclusive, do not scale.
Cadence keeps this from becoming a one-off exercise. A weekly topline email covering spend, marginal ROAS, and any anomalies, a monthly incrementality update that reports on active tests, and a quarterly measurement-plan review with finance together build a rhythm that finance can plan around rather than react to.
Pro Tip: When lift confidence falls below your agreed threshold, pause any planned budget increase until the next controlled test closes rather than acting on a partial read.
Measurement and attribution: rules to agree on before reporting begins
Attribution and incrementality choices change what a dashboard reports before a single dollar moves. Agreeing on the rules in advance keeps the numbers stable enough to act on.
- Lock a measurement framework up front, including conversion definitions, lookback windows, and an annual incrementality plan, so measurement becomes a governance process rather than a case-by-case negotiation.
- Expect credit shifts when attribution models change. Google’s own guidance notes that switching models can shift conversion credit, introduce fractional conversions, and create a reporting time lag, which means CPA and ROAS targets need recalculating, and performance should not be judged until the new conversion window has fully passed.
- Run incrementality or Conversion Lift studies when spend and data volume support them. Google has lowered the spend thresholds for incrementality experiments and improved the underlying methodology, making tests practical for most $25,000-plus monthly budgets rather than only the largest advertisers.
- Demand transparency on method, not just results. Sample sizes, documented assumptions, and senior review of any test should be visible in the dashboard appendix, not withheld as a black box.
The discipline pays off at the C-suite level. McKinsey’s research on CMO-CFO alignment points to avoiding vanity metrics and tying marketing measurement directly to financial outcomes as the practice that builds lasting trust between marketing and finance, more than any single quarter’s inflated number ever will. Readers who want the mechanics behind attribution shifts can review our breakdown of attribution model changes for a deeper technical walkthrough.
Implementation checklist: what to demand when commissioning a dashboard
Before signing with any agency to deliver this kind of reporting, confirm the deliverables and service terms in writing.
Minimum deliverables to request:
- A monthly executive one-pager with the headline marginal-impact metric and one to three recommended actions.
- A drillable appendix covering channel, campaign, and test-level detail.
- Raw-data export access, not just screenshots or a locked report.
- A written incrementality study plan with results reported on the agreed cadence.
Operational terms worth pinning down:
- Offline conversion upload latency and how it affects reporting accuracy.
- Frequency of senior operator review, not just account manager touches.
- A defined change-management process for any attribution model update.
Red flags to walk away from: no incrementality plan at all, attribution explained in vague terms rather than documented rules, no sample-size or confidence reporting next to lift numbers, and a team made up entirely of junior staff with no senior sign-off. The simplest validation step is to ask for a sample executive dashboard and a written measurement plan before signing anything, and to confirm by name who on the senior team will review the account.
A senior operator’s note on what actually works
Senior oversight catches waste that junior account management misses: wrong conversion windows, stale attribution assumptions, budget sitting in campaigns an incrementality test would flag as flat. In the first 30 days, expect an account audit and a measurement framework proposal. By 90 days, the first incrementality results should be shaping budget decisions. By 180 days, the dashboard itself should be running on a predictable cadence with finance already reading it. Our own free audit reflects this approach.
— Eric
How we build the executive dashboard at North Country Consulting
We run every account with senior oversight: no junior-only teams, no black-box attribution, no vanity metrics dressed up as progress. Our Google Ads management work includes account restructures, conversion tracking and attribution rebuilds, and reporting built to hold up in front of a CFO, not just a marketing team.

- A senior-led audit of your current account structure and tracking setup.
- A sample executive dashboard showing what your reporting could look like.
- A recommended roadmap tied to measurable financial outcomes, not platform clicks.
If you are spending $25,000 or more a month on Google Ads and want reporting finance will actually trust, request your free Google Ads audit and we will show you exactly where the current setup is leaving revenue on the table.
FAQ
What makes a Google Ads dashboard “CFO-grade” rather than standard reporting?
A CFO-grade dashboard leads with marginal impact and margin contribution instead of clicks or impressions, and it shows the confidence level behind every number. Standard reporting tends to report platform conversions at face value, while CFO-grade reporting separates measured results from modeled ones.
How often should an executive dashboard be updated?
A weekly topline update covering spend and the marginal-impact headline keeps leadership current, with a monthly incrementality update and a quarterly measurement-plan review alongside finance. This cadence matches how incrementality testing is designed to run in stages rather than producing a single static report.
How do attribution model changes affect reported Google Ads performance?
Switching attribution models can shift conversion credit between channels, introduce fractional conversions, and create a short reporting lag before the new model stabilizes. Google Ads recommends updating CPA and ROAS targets after any model change and waiting for the full conversion window to pass before judging results.
What does North Country Consulting’s free Google Ads audit include?
The free audit reviews account structure, conversion tracking, and attribution setup, and produces a sample executive dashboard along with a recommended roadmap. It is built for businesses spending $25,000 or more per month that want senior-led management rather than a standard agency relationship, and you can request it directly.
When is an incrementality test worth running instead of relying on platform data?
An incrementality test is worth running once spend and conversion volume are large enough to produce a statistically meaningful result, which Google has made more achievable by lowering experiment spend thresholds. Below that volume, a test may run too long or return inconclusive results to justify a budget decision on its own.
Sources
- The CMO Survey: marketers claim a broader role and increased influence amid pressures
- Best practices for managing attribution model changes – Google Ads Help
- Incrementality experiments updates – Google Ads support
- The CMO’s comeback: aligning the C‑suite to drive customer‑centric growth